Description:
The Conductivity of Liquids and Gases unit has been specifically designed to enable students to measure and compare the thermal conductivities of various liquids and gases. It’s designed to facilitate quick and effective cleaning and to minimize thermal losses.
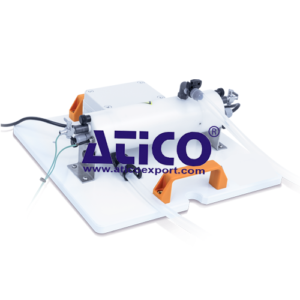
The unit comprises a cylindrical, electrically heated, nickel-plated aluminum core surrounded by a nickel-plated aluminum sleeve. The core and the sleeve are arranged so that a uniform narrow annular gap is created between the two parts, which is filled by the liquid or gas to be analyzed.
The temperature on each side of the fluid is measured by thermocouples in the surface of the core and the sleeve.
Demonstration Capabilities
Understanding the use of the Fourier rate equation in determining the rate of heat flow by conduction through liquids or gases
Measuring the constant of proportionality (the thermal conductivity k) of different liquids such as water and glycerol
Calibrating the unit for heat losses using a gas, such as air with known thermal conductivity, then measuring the temperature difference across different gases, such as carbon dioxide and helium to determine their thermal conductivity k
Specification
Thickness of fluid sample – 0.5mm (Fixed by the annular gap)
Nominal heat transfer area – 1.225 x10⁻² m²
Gas / liquid sample volume – 6.126ml
Maximum heater power – 200W at 24V
Maximum operating temperature – 90°C (limited by integral thermostat)
Features
- Temperatures and other signals such as flow rates, heater voltage and current are displayed on a diagrammatic representation of the equipment
- Control outputs are operated by a control slider or typing in a value between 0 and 100%. Sensor values are read directly in engineering units
- PID automatic control option is available, permitting the temperature set-point to be achieved quickly and precisely, coping with disturbance rejection
- A maintenance screen allows for PID parameter adjustment and thermocouple calibration
- Data from the sensors are logged into a spreadsheet format, with operator control over the sampling intervals (or ‘single-shot’)
- Sophisticated graph-plotting facilities are provided, including plotting of both measured and calculated values
Graphs update in real-time as the samples are being taken - Processing of measured values to obtain calculated values is linked to the questions and answers to ensure student understanding
- Experiment data samples are saved, or exported in Microsoft Excel format
- Real-time sensor data is displayed independently from the data logging. It is possible to check the recent history graphical display to inspect the temperature stability prior to taking a sample